Active stock traders who constantly monitor the market are always looking at price charts to spot patterns and signals. However, like all things, the process of Market Analysis carry notable risks. One of the key risks here is that plotted patterns may fail and move against the projected analysis. To mitigate this, traders use Volume to validate if a price action move is sustainable or not.
In this post, we'll look at some ways in which Volume can be used to validate price action patterns.
Volume Validates Price Action
Every trader knows that not every chart pattern and signal will move according to their expected projection. Especially in the short term, price action can be volatile and unpredictable. As such, a means of mitigating this risk is necessary. To account any potential failure in patterns and trends, traders will use Volume as a means of validating the strength and sustainability of a move.
Simply put, Volume is the fuel of any price movement. Volume in the context of trading refers to the number of shares exchanged between buyers and sellers participating in the stock market. When a bullish chart pattern forms, a trader wants to see a considerable increase in buying volume. On the flipside, a bearish chart pattern formation must show a notable spike in selling volume.
When validating price action through Volume, it is critical that the volume surges alongside the price action pattern. A projected pattern always has a higher chance of following through when accompanied by above average volume turnover. This is very important since it provides an added layer of confirmation when placing hard earned money in the market.
How it Looks in the Chart
1. Breakout with above average volume
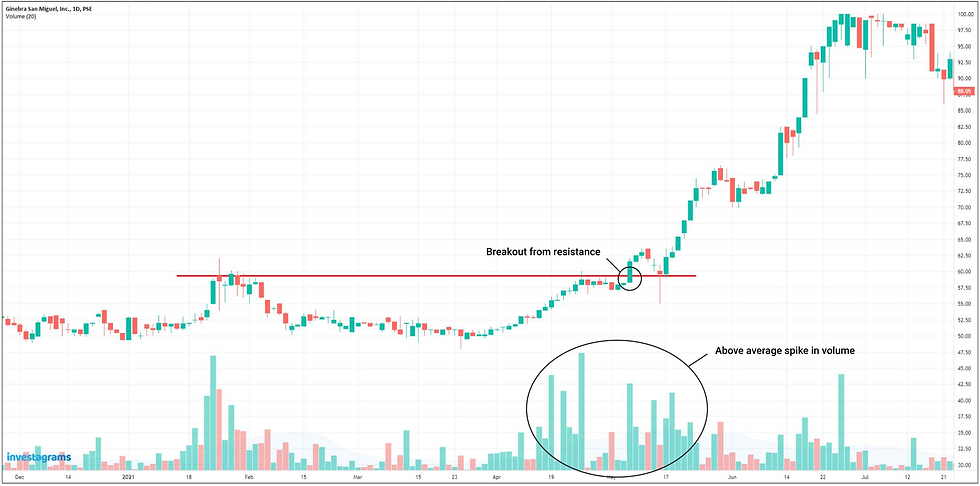
A valid price breakout above a key resistance level must ALWAYS be accompanied by above average volume. This is important because resistance levels tend to harbor a lot of sellers. To be able to absorb all the profit taking at resistance and sustain the breakout move higher, buying volume must heavily outweigh the selling volume.

The chart above illustrates a classic breakout move which is accompanied by sustained above average buying volume. Due to the surge in buying, price climbs higher and creates an uptrend rally.
For setups like this, wherein breakouts are validated by above average volume, a buy on breakout strategy can be implemented to participate in the breakout rally.
Cases wherein a price breakout is accompanied by surging buying volume can be due to various reasons. Strong company earnings, a new product, mergers and acquisitions, strong growth forecasts. These are some of the few fundamental reasons as to why increased buying volume happens. The bottom line is that when buying volume surges, there is usually good news behind it.
2. Breakdown with above average volume
A valid price breakdown below a key support level must ALWAYS be accompanied by above average volume. When a breakdown is validated by a surge in selling volume, this points to a potential shift to a downtrend. Key support levels harbor a lot of buyers. In order for the price to dive further, selling volume has to heavily outweigh the amount of buyers.

The chart above illustrates a classic breakdown move which is accompanied by sustained above average selling volume. Due to the surge in selling, price dips further and creates a panic selling move.
You want to avoid setups like this at all costs. If you have a short term position on a stock making a pattern like this, it is advised to cut your losses to prevent further damage.
A price breakdown with surging selling volume can be due to various reasons. The worst case would be a major fundamental risk that can heavily influence the performance of the company moving forward. If this is true, then expect selling to remain elevated in the near term.
3. Institutional accumulation during consolidation
Another use case for Volume is that it can be used to spot potential institutional accumulation. It is important to note that major financial institutions cannot fully hide their buying activity. Their trading footprints will always show as steady buying activity that can be monitored in the chart.
Institutional accumulation simply means that there are some financial institutions that are gradually hoarding shares of stocks for a sustained period of time. They do not allocate all their position in 1 day since that can trigger a panic buying scenario. Instead, they spread their buying transactions each day so as not to draw attention.
In the Philippines, foreign buying is something that is closely monitored. This is due to the simple reason that their buying power is huge. They can send stocks flying or diving due to their capacity for sustained buying and selling. As such, trading in the Philippines market must also use net foreign volume as a means of validating potential institutional accumulation.

The chart above illustrates a classic institutional accumulation. Notice that before the initial spike in buying, volume was relatively low. Then after the initial spike, volume becomes elevated and net foreign volume gradually increases. This is indicative of several institutions gradually accumulating shares until the news comes out and triggers a breakout move.
The price chart will usually reflect a sideways pattern during a period of accumulation. If a trader happens to spot ongoing accumulation patterns in volume, it is advised to buy at the key support of the consolidation move and hold the position as long as buying volume carries it towards a breakout.
We hope you loved our posts! To learn more about trade and investment, access the Online Learning section of our website to enjoy our free Learning Module.
Comments